Overview of How Specutils Represents Spectra#
The main principle of specutils is to work as a toolbox. That is, it aims
to provide the pieces needed to build particular spectroscopic workflows
without imposing a specific required set of algorithms or approaches to
spectroscopic analysis. To that end, it aims to represent several different
types of ways one might wish to represent sets of spectroscopic data in Python.
These objects contains logic to handle multi-dimensional flux data, spectral
axes in various forms (wavelenth, frequency, energy, velocity, etc.), convenient
and unobtrusive wcs support, and uncertainty handling. The core containers also
handle units, a framework for reading and writing from various file formats, and
arithmetic operation support.
The core data objects are primarily distinguished by the different ways of
storing the flux and the spectral axis . These cases are detailed below, along
with their corresponding specutils representations:
A 1D flux of length
n, and a matched spectral axis (which may be tabulated as an array, or encoded in a WCS). This is what typically is in mind when one speaks of “a single spectrum”, and therefore the analysis tools are general couched as applying to this case. Inspecutilsthis is represented by theSpectrumobject with a 1-dimensionalflux.A set of fluxes that can be represented in an array-like form of shape
n x m (x ...), with a spectral axis strictly of lengthn(and a matched WCS). Inspecutilsthis is represented by theSpectrumobject wherelen(flux.shape) > 1. In this sense the “1D” refers to the spectral axis, not the flux. Note thatSpectrumsubclasses NDCube, which provideds utilities useful for these sorts of multidimensional fluxes.A set of fluxes of shape
n x m (x ...), and a set of spectral axes that are the same shape. This is distinguished from the above cases because there are as many spectral axes as there are spectra. In this sense it is a collection of spectra, so can be thought of as a collection ofSpectrumobjects. But because it is often more performant to store the collection together as just one set of flux and spectral axis arrays, this case is represented by a separate object inspecutils:SpectrumCollection.An arbitrary collection of fluxes that are not all the same spectral length even in the spectral axis direction. That is, case 3, but “ragged” in the sense that not all the spectra are length
n. Because there is no performance benefit to be gained from using arrays (because the flux array is not rectangular), this case does not have a specific representation inspecutils. Instead, this case should be dealt with by making lists (or numpy object-arrays) ofSpectrumobjects, and iterating over them.Specutils does provide a
SpectrumListclass which is a simple subclass oflistthat is integrated with the Astropy IO registry. It enables data loaders to read and return multiple heterogenous spectra (see Loading Multiple Spectra). Users should not need to useSpectrumListdirectly since alistofSpectrumobjects is sufficient for all other purposes.
In all of these cases, the objects have additional attributes (e.g. uncertainties), along with other metadata. But the list above is exhaustive under the assumption that the additional attributes have matched shape to either flux or spectral axis (or some combination of the two).
As detailed above, these cases are represented in specutils via two classes:
Spectrum (Cases 1 and 2, and indirecly 4) and
SpectrumCollection (Case 3). A diagram of these data structures is
proved below.
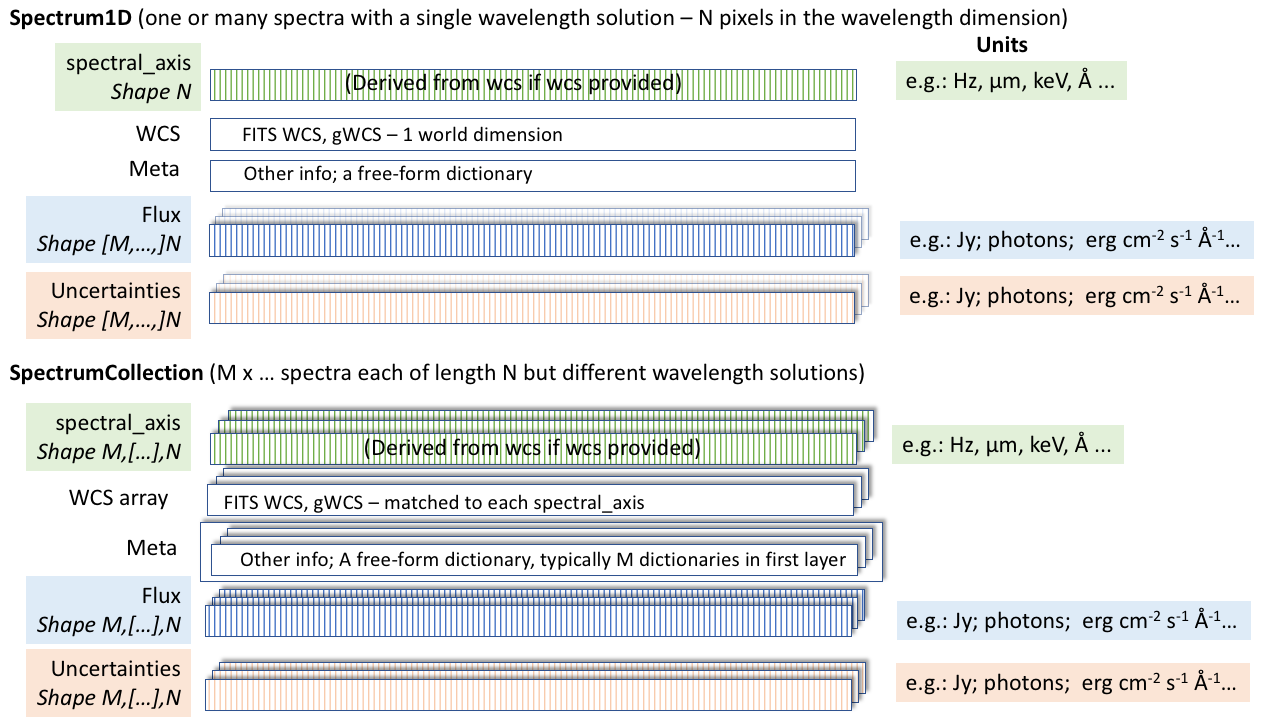
While they all differ in details of how they address specific multidimensional
datasets, these objects all share the core features that they carry a “spectral
axis” and a “flux”. The “spectral axis” (Spectrum*.spectral_axis) is the physical
interpretation for each pixel (the “world coordinate” in WCS language). For
astronomical spectra this is usually wavelength, frequency, or photon energy,
although for un-calibrated spectra it may simply be in pixel units. The “flux”
(Spectrum*.flux) is the spectrum itself - while the name “flux” may seem to imply a
specific unit, in fact the flux can carry any unit - actual flux, surface
brightness in magnitudes, or counts. However, the best form for representing
calibrated spectra is spectral flux density (power per area per spectral
spectral axis unit), and the analysis tools often work best if a spectrum is in
those units.